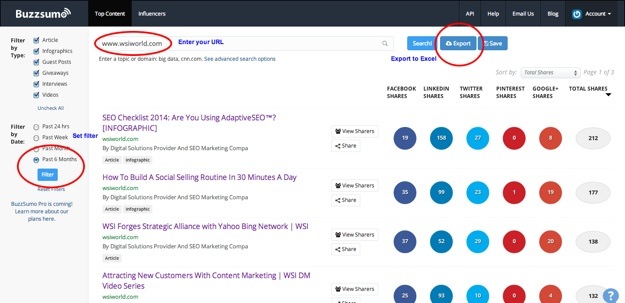
A while back, we gave you a rundown of our content marketing plan for 2014. With that in mind, we wanted to take a look at the blog by breaking it down into post type. Using BuzzSumo, a tool we've mentioned before, we gathered our posts' share data from January 2014 to May 2014. Then, we simply exported the resulting data to Excel. Here's what that looked like:
Next, using only the SUM function in Excel, we made sure the data set matched what we wanted to measure. So we removed posts prior to January 2014, added the total number of shares and also separated those shares by post type. Again, we're looking at post type because our content plan calls for six specific posts types each month and we want to know how each different one is doing. You might want to separate by topic, post length or author - do whatever makes the most sense for you. Here's what the data looks like in a yummy pie chart (created in minutes using RapidTables):
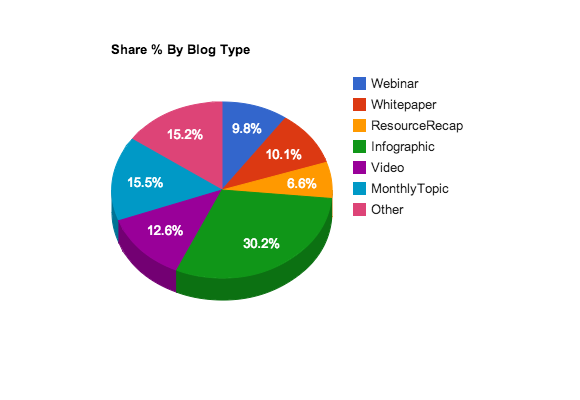
Up until this point, we could have guessed which post types were doing the best for us, but we didn't actually know. It's a lot different when you see real data (especially when it's in a pie chart!). As you can see, our infographic blogs (30.2%) are shared almost twice as much as any other post type (huge shout out to my team that puts these together, they are always awesome)! The next most-shared post type is our in-depth, analytic posts focused on the topic of the month at 15.5% (you are reading June's monthly topic post right now). Then comes our 'other' category (15.2%), which includes posts like our recent announcement that we've joined Hootsuite's Solution Partner Program. Following that, we have our DM Video Series ad whitepaper release posts, at 12.6% and 10.1%, respectively. Bringing up the rear are our monthly webinar announcements (9.8%) and resource recap posts (6.6%).
The data makes sense to us. Our infographics contain valuable information and they look great, so of course people are proud to share them (it makes them look good). Our monthly topic posts are also packed with value as they usually deep dive into analytics, tools or advanced strategies. The other kinds of posts on our blog are usually releasing or announcing a resource we've created.
It seems that whitepapers and videos do okay on social media, but we start to see a drop off with webinars and recaps. We do get some direct registrations from the webinar blogs, but is that enough to make them worthwhile? Should we cut out some of the underperforming post types and do two analytical posts instead? Those are internal discussion that we've yet to have, but you get the idea: the data is giving us insight as to what's happening with our content.
For another perspective, we wanted to look at the average number of shares per post type. Here's that data in a chocolate bar chart:
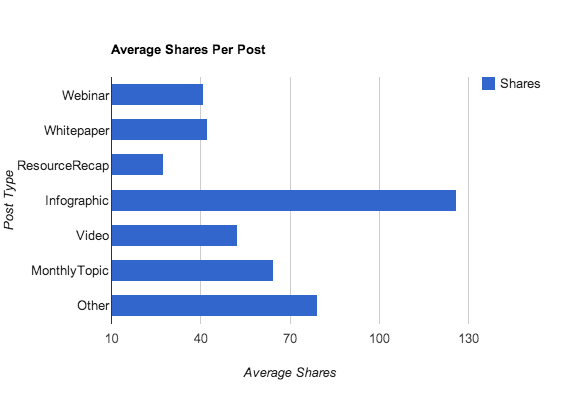
The date looks more or less the same, with one exception. The 'other' category shows a significant jump in average shares per post, which tells us that people are pretty interested in our big brand announcements. Perhaps this suggests that there's an opportunity to be more open and transparent about the inner workings of our brand - people are certainly interested. Again, that's a subject for an internal conversation, but the data is there.
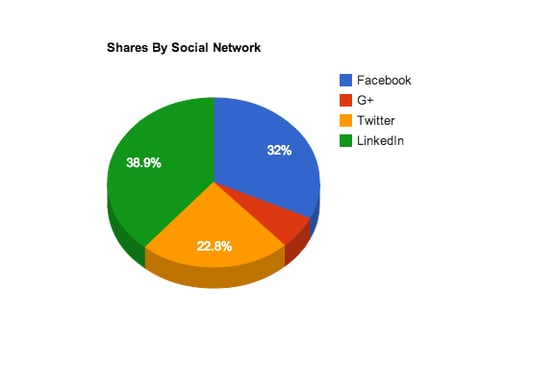
Finally, we wanted to get a snapshot of the social landscape and determine the social networks where our content performs best. We can neither confirm nor deny whether this was done because we wanted to use another pie chart. Here's what we found out:
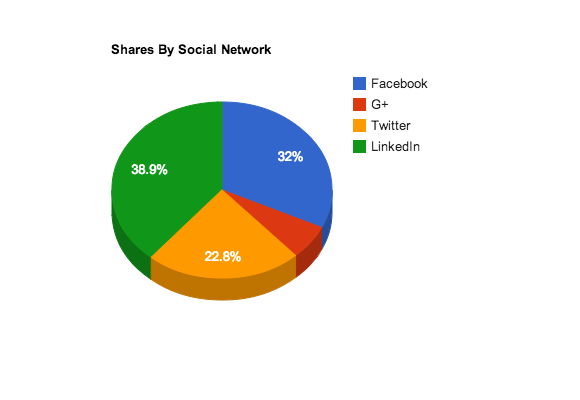
The scrumptious pie is telling us that 71% of our all shares on the big four networks come from Facebook and LinkedIn. Our Twitter followers are hanging in there with 22.8% of shares while Google+ is lagging well back at just 6.3% of shares. This distribution doesn't necessarily need to be even, but it suggests that we need to ramp up our G+ game a little bit. On the other hand, given that so much of our sharing takes place on LinkedIn - which makes sense given the consultive approach of our industry - its a strong indication that most of our audience likes to engage on that platform.
Whatever the case, you can see that with just a little bit of effort, a few tools and a couple slices of pie(!), we've uncovered a few possible opportunities and some strategic talking points for the second half of 2014. Oh, and do this with your competitors' content to discover what's working best for them. Do this with the top influencers in your industry to see what they're creating and sharing. Heck, just doing this every few months for your own content will give you a new perspective on what's happening and some insight as to why - we know it has for us.
Happy (pie) hunting!

